


Talking Points:
- It was an eventful week for markets, as the Federal Reserve hiked rates for only the third time since 2006.
- The net impact to the Greenback was a move of weakness, and this highlights peripheral themes in the Euro and the Yen that could remain pensive during a data-light calendar for next week.
- If you’re looking for trading ideas, check out our Trading Guides. And if you’re looking for ideas that are more short-term in nature, please check out our Speculative Sentiment Index (SSI) Indicator.
To receive James Stanley’s analysis directly via email, please SIGN UP HERE
This week brought quite a few drivers to markets. The Fed hiked rates on Wednesday, and the net reaction was a quick-move of USD-weakness. The Euro popped-higher on Thursday in the wake of Dutch election results, but then fell on Friday as French election poll numbers indicated a higher percentage of voters leaning towards Marine Le Pen.
Next week sees macro data slow a bit, as we only have six ‘high impact’ announcements on the docket. The RBNZ rate decision on Wednesday could be interesting, and this comes just day after Global Dairy Prices are released, so we could see a volatile Kiwi-Dollar around the middle of next week.
But outside of that, data is relatively light. This could be an opportune time for market themes to develop or for traders to react to this week’s moves. Below, we look at three of the more interesting areas for traders to watch as we move through next week.
Will the Dollar Find Support?
Probably one of the more surprising events of this week was the significant drop in the U.S. Dollar after the Federal Reserve hiked rates for only the third time in the past ten years. The deductive message here was that the Fed was more dovish with forward-looking expectations than what markets were looking for. Given the persistence towards ‘policy normalization’ expressed by multiple Fed members in the lead-in to this week’s rate decision, and markets were likely surprised that the Fed did not use this opportunity to increase guidance for rate hikes going to the end of last year. So, while rates were hiked on Wednesday, the Fed stuck to their expectation for the number of rate hikes going to the end of next year.
Correspondingly, stocks popped-higher as the Fed did not highlight a greater expediency towards policy normalization; but the Dollar dropped as the prospect of even-faster rate hikes was priced-out of markets.
The big question at this point is how long this bout of weakness in the Greenback might last. By scrolling out and taking a ‘bigger picture’ look at the U.S. Dollar, we can see that price action is still bullish from the monthly chart; with current support showing around the resistance area of the range that had traded throughout 2015, and resistance coming in at the 61.8% Fibonacci retracement of the 16-year move in the Greenback.

Chart prepared by James Stanley
Looking at the shorter-term 4-hour chart, we can see the one-sided move in the Dollar as price action ran from 101.80 down to 100.25 around the Fed’s rate hike on Wednesday. We’re looking at two different zones underneath current price action where support may show-up, which could then lead to a bullish stance or bullish setups in the U.S. Dollar if support does, in-fact, show.

Chart prepared by James Stanley
Is the Euro about to go ‘bullish’?
Weakness in the Euro has been a rather pervasive theme for some time now. European QE was first discussed in May of 2014, announced in July of 2014 and pretty much since then there’s been a sense of negativity wrapped around the currency due to the numerous geopolitical issues that have developed throughout Europe.
But inflation is ticking higher. Growth is beginning to look a bit more consistent. And the ECB may be nearing a point in which they’ll no longer need QE. We’re, of course, discussing the prospect of a ‘taper tantrum’ as shorts hurriedly rush to cover positions as evidence becomes clearer that European QE may be done ‘sooner rather than later’. Thus far, the ECB has done a good job of allaying this fear from markets.
But just as we saw with the dramatic drop in the value of the Euro after the ECB announced QE (but before the program actually started in March of 2015), traders likely won’t wait around to begin pricing-in this theme if it is looking as though it might be a likely outcome. On the chart below, we can see how the bulk of the bearish movement in EUR/USD came after the ECB announced QE, but before it ever even started. And after QE actually started, EUR/USD spent much of the next two years in a bear-flag formation:
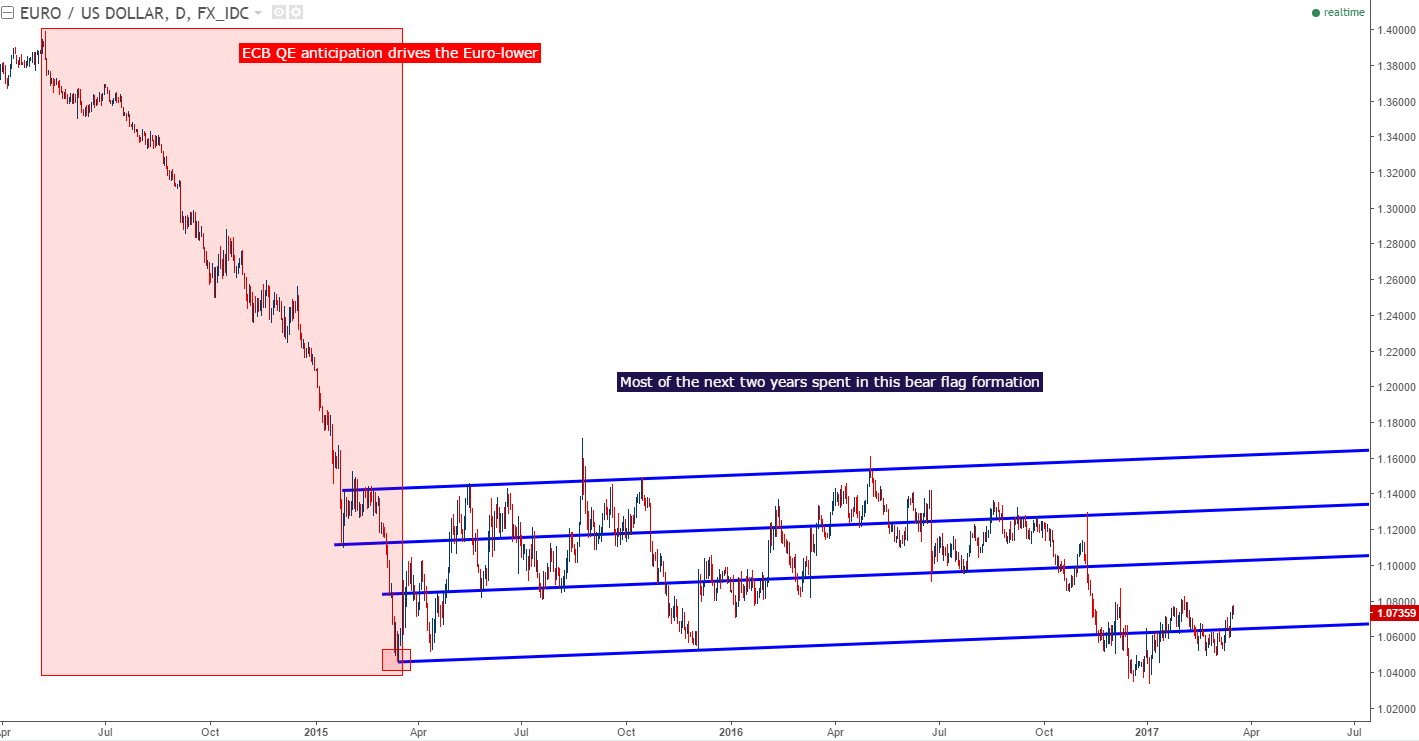
Chart prepared by James Stanley
On the hourly chart below, we’re focusing-in on the recent bullish move in EUR/USD after last week’s ECB meeting and this week’s FOMC rate decision. We’ve identified three different support zones that could be interesting in the effort of trading a top-side continuation move.

Chart prepared by James Stanley
Is the Yen Nearing Resistance?
For those looking at acquiring long-exposure in the U.S. Dollar, the Japanese Yen likely remains an attractive counterpart. The BoJ held a rate decision this week, but little by way of new information came out. The more pressing concern here seems to be how confident the Bank of Japan might be in the recent ‘Trump Bump’ that’s enveloped global markets. If the BoJ gets more confident around the recent signs of stability, they may scale-back their QE efforts, and this could bring strength into the Yen. This is likely something that the Bank of Japan wants to avoid, and given that Japan has been singled-out by the current administration as NOT being a currency manipulator means that we could see some additional dovish action out of Japan.
On the daily chart below, we’re looking at a confluent zone of support in USD/JPY that spans an ~80-pip range from 111.61 up to 112.40. This zone of support has multiple Fibonacci retracement levels but perhaps more important, this zone came in as a key area of support to hold the lows of the January/February retracement. Should price action revisit this zone next week, this could open the door for bullish USD/JPY setups.
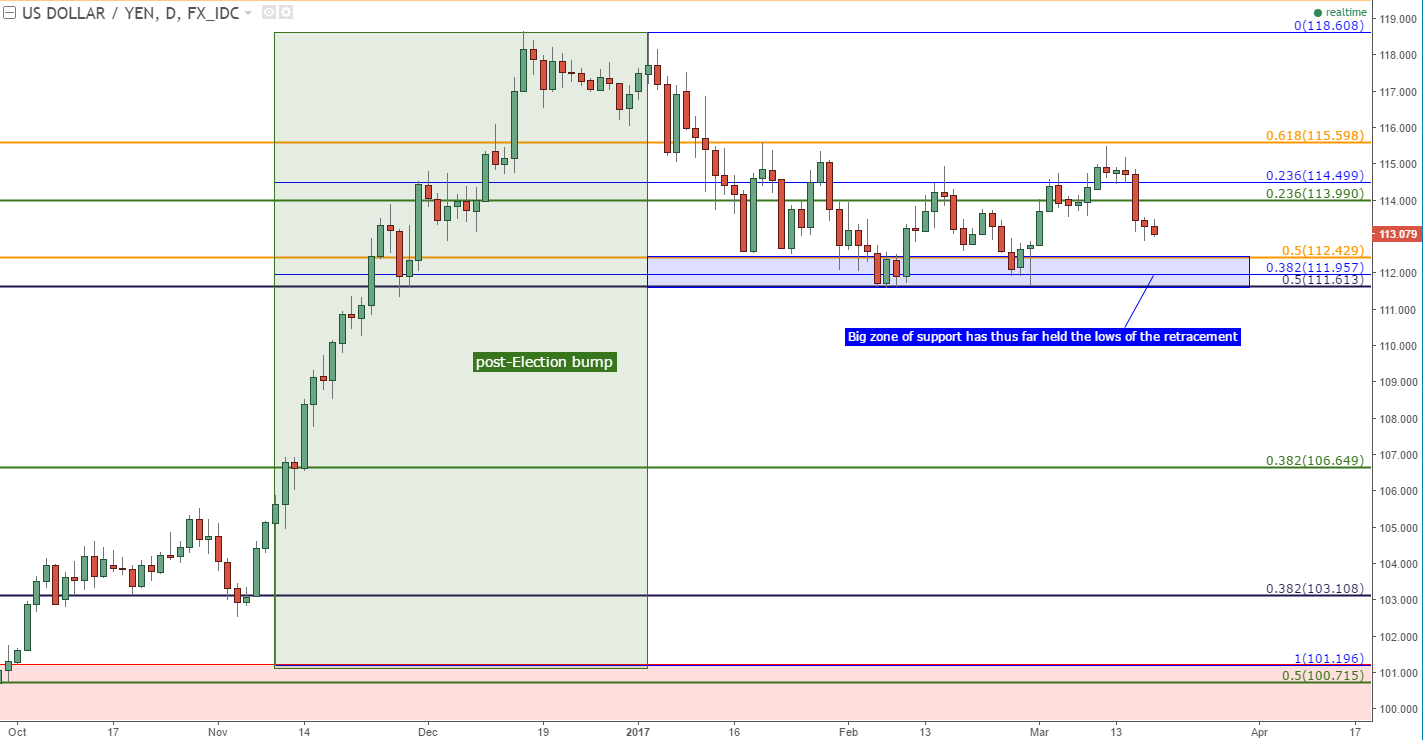
Chart prepared by James Stanley
On the hourly chart below, we can see where buyers have stepped-in to support the pair above this longer-term zone of interest. This has produced a short-term range between the approximate values of ¥113.00 and ¥113.55. For traders that want to add bullish exposure, they’d likely want to wait for either of a) this short term resistance to yield as evidence that buyers are able to re-take control of USD/JPY price action or b) a re-visit of that longer-term support zone underneath current price action.
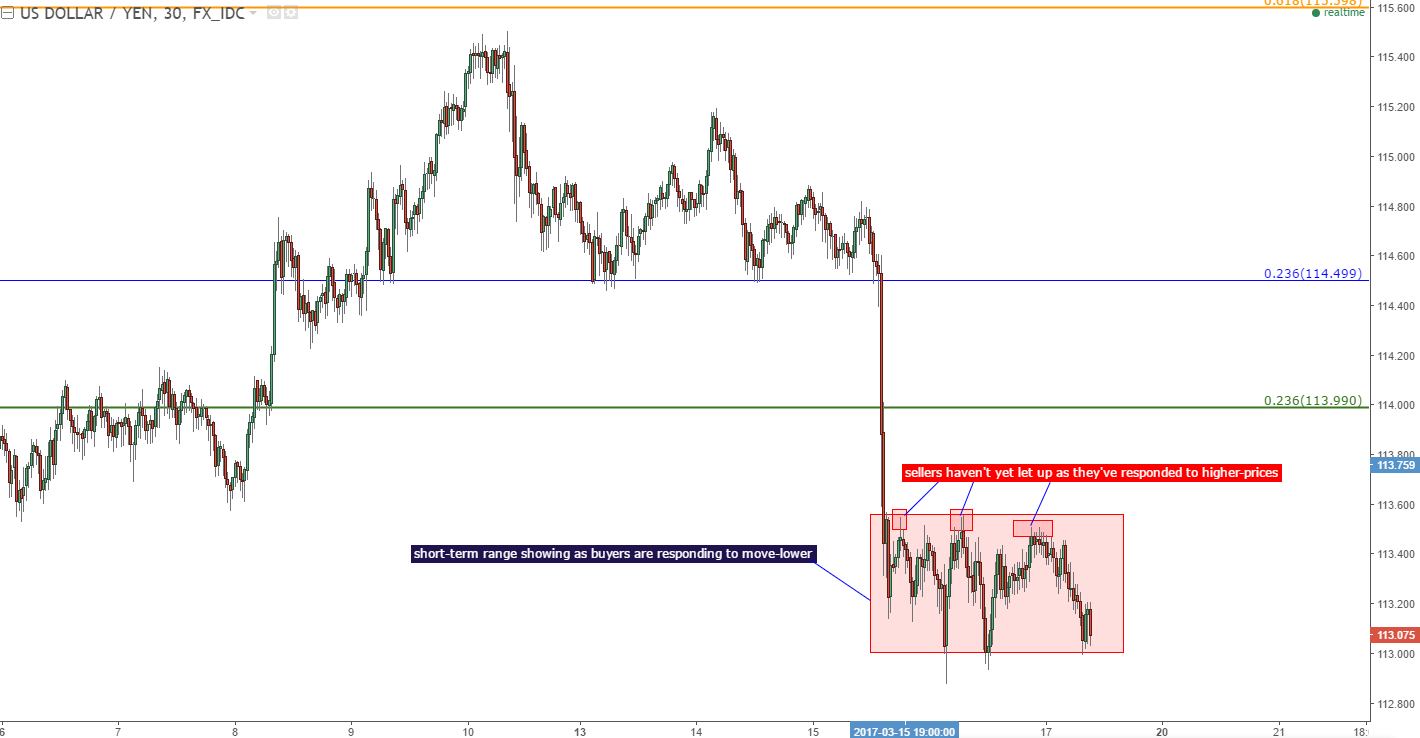
Chart prepared by James Stanley
--- Written by James Stanley, Analyst for DailyFX.com
To receive James Stanley’s analysis directly via email, please SIGN UP HERE
Contact and follow James on Twitter: @JStanleyFX


