 Scoop has an Ethical Paywall


National House Prices Continue To Rise Post-COVID, Says REINZ
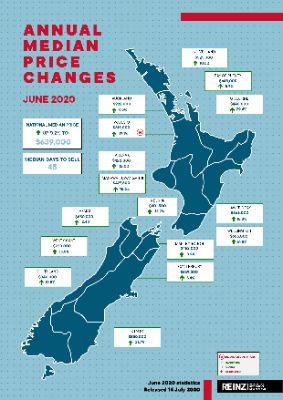
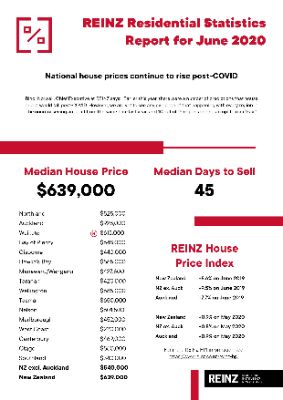
House prices have continued to surpass predictions for how they would perform post-COVID with median house prices across New Zealand increasing by 9.2% in June to $639,000, up from $585,000 in June 2019 and up from $620,000 (3.1%) in May 2020, according to the latest data from the Real Estate Institute of New Zealand (REINZ), source of the most complete and accurate real estate data in New Zealand.
June marks 105 months in a row of year-on-year median prices increases for the country.
Median house prices for New Zealand excluding Auckland increased by double digits with an 11.3% uplift to $540,000, up from $485,000 in June last year and up from $530,000 in May this year.
Additionally, Auckland’s median house prices increased by 9.2% to $928,000 up from $850,000 at the same time last year and up from $904,500 in May this year. This was the second highest median price on record for the City of Sails.
Waikato achieved a record median price in June of $615,000 up from the previous record of $600,000 set last month, thereby marking two consecutive months of record median prices.
Bindi Norwell, Chief Executive at REINZ says: “Earlier this year, there were a number of predictions that house prices would fall post-COVID. However, we are yet to see any evidence of that happening with every region in the country seeing an uplift from the same time last year, and 10 out of 16 regions seeing an uplift from May.
“With wage subsidies and mortgage ‘holidays’ still firmly in place, and demand for good property exceeding supply, we wouldn’t be so bold as to say there won’t be an easing of pricing in the coming months when these support mechanisms come to an end. But right now, Kiwis’ love affair with property continues unabated – especially with the low interest rates we currently have in the market,” she continues.
“The Waikato region was the only region in the country with a record median price in June, a 17.1% increase year-on-year to $615,000 up from $525,000. With an 18.3 percentage point uplift in sales over the $500,000 mark when compared to the same time last year, and a strong level of increase from Auckland buyers, it’s little surprise that median prices have seen such a rise,” says Norwell.
“Gisborne saw the largest annual increase in median price of all the regions with a 29.4% uplift to $440,000 up from $340,000 in May last year. This was followed by strong price rises in Otago and Southland with 21.7% and 19.8% increases respectively to $550,000 and $340,000.
“Looking at the Auckland region, prices increased when compared to the same time last year in all Districts bar Papakura District which saw a 7.9% fall in median price (from $710,000 to $654,000). Auckland City was the only area with double digit increases, with a 17.1% rise to $1,147,500 - $13,500 off the record set in March this year,” she continues.
Most properties sold in the month of June for 4 years
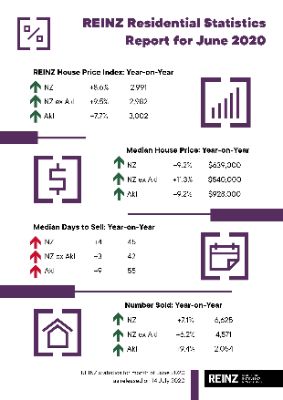
The number of properties sold in June across New Zealand increased by 7.1% from the same time last year (from 6,184 to 6,625 – the highest number of properties sold in a June month for 4 years.
For New Zealand excluding Auckland, the number of properties sold increased by 6.2% when compared to the same time last year (from 4,306 to 4,571) – the highest for the month of June in 4 years.
In Auckland, the number of properties sold in June increased by 9.4% year-on-year (from 1,878 to 2,054) – the highest for the month of June in 4 years.
Shaking off the COVID-19 impact, June was the first time in three months where regions have started to see increases in annual sales volumes, with 10 out of 16 regions seeing annual increases.
Regions with the largest increase in annual sales volumes during June were:
- West Coast: 43.2% (from 37 to 53 – 16 more houses) – the highest for the month of June in 14 years
- Southland: 27.7% (from 155 to 198 – 43 more houses) – the highest for the month of June in 13 years
- Taranaki: 19.7% (from 147 to 176 – 29 more houses)
- Waikato: 14.0% (from 607 to 692 – 85 more houses) – the highest for the month of June in 4 years.
“Not only did sales volumes return to ‘normal’ in June, they were the highest for a June month in four years suggesting that the impact of lockdown is now well and truly behind the country, and that people have been able to get on with their sales and purchasing decisions as per usual,“ says Norwell.
“With thousands of New Zealanders returning home as a result of New Zealand’s limited cases of COVID-19, many of these individuals are looking to purchase property for their family to live in which is also likely to have bolstered June’s sales volumes,” points out Norwell.
“However, we’ve said it before, and it’s important to say it again, that this may well be a post-lockdown peak in activity levels. There are concerns that with the wage subsidies, mortgage holidays ending and an election in September, that there may be a potential trough in activity levels in the coming months,” she warns.
“Although, with a 19.7% increase in new listings in June – the highest for the month of June in 4 years – hopefully this will lead to more choice for buyers in the coming months,” continues Norwell.
REINZ House Price Index (HPI) shows underlying value in the market is holding
The REINZ House Price Index for New Zealand, which measures the changing value of property in the market, increased 8.6% year-on-year to 2,991.
The HPI for New Zealand excluding Auckland increased 9.5% from June 2019 to 2,982 and Auckland’s HPI increased 7.7% year-on-year to 3,002.
In June, Manawatu/Wanganui had the highest annual growth rate with a 19.4% increase to a new record index level of 3,683. In second place was Gisborne/Hawke’s Bay with an annual growth rate of 17.8% to a new record index level of 3,226 and in third place was Southland with a 12.2% annual increase to 3,415.
Looking at the month-on-month shifts to help gain a clearer picture of how the underlying value of the market is recovering from COVID-19, there were three new record high index levels recorded in June, with 9 of the 12 regions recording a month-on-month increase. The only exceptions to this were Northland (-0.7%), Bay of Plenty (-0.7%) and Otago (-1.0%).
The 1-month data showed that the underlying value in the market has mostly held strong and begun to recover compared to May. The HPI for the country increased 0.9%, for New Zealand excluding Auckland it increased 0.8% and Auckland’s HPI rose 0.9% compared to May.
Days to sell returning to a more normal level
In June, the median number of days to sell a property nationally increased 4 days from 41 to 45 when compared to June 2019, although it was down from 58 days in May.
For New Zealand excluding Auckland, the median days to sell increased by 3 days from 39 to 42, but again was down from 57 days in May.
Auckland saw the median number of days to sell a property increase by 9 days from 46 to 55 year-on-year, also down from the 62 days seen in May.
Tasman had the lowest days to sell of all regions at 28 days – down 17 days from the same time last year and down 37 days from May. Tasman had its lowest days to sell for the month of June since records began and was the only region with a median number of days to sell of less than 30 days.
The West Coast had the highest days to sell at 96 days, up 43 days on May’s figure and likely due to delayed sales from pre-COVID.
Looking at the regions as a whole, 13 out of 16 regions decreased month-on-month when it came to days to sell, with the only exceptions being Northland (up 9 days on May), Bay of Plenty (up 12 days on May) and West Coast (up 43 days on May).
“After last month’s high median number of days to sell a property, we were expecting a return to a more normal winter pattern over the next few months and it seems we are starting to see that already,” concludes Norwell.
Auctions recovering post-COVID
Auctions were used in 11.1% of all sales across the country in June, with 733 properties selling under the hammer – up from 10.0% at the same time last year, when 618 properties were sold via auction –indicating a return to a more normal level of auctions after a few months of restrictions.
Gisborne had the highest percentage of auctions across the country with 46.3% (25 properties) sold under the hammer, up from 26.3% (15 properties) in June 2019.
Auckland had the second highest percentage of auctions in New Zealand with 21.5% of properties (442 properties) sold under the hammer up from 17.7% at the same time last year (333 properties). This was followed by Bay of Plenty with 12.8% (55 properties) sold under the hammer up from 10.5% in June 2019 (48 properties).
Inventory falls for 12 months in a row
The total number of properties available for sale nationally decreased by -11.7% in June to 20,772 down from 23,519 in June 2019 – a decrease of 2,747 properties compared to 12 months ago and the lowest level of inventory for the month of June since records began.
Regions with the largest percentage decrease in total inventory levels were:
- Taranaki: -41.8% from 613 to 357 – 256 fewer properties
- Marlborough: -37.3% from 311 to 195 – 116 fewer properties
- Northland: -24.5% from 1,447 to 1,092 – 355 fewer properties.
Price Bands
The number of homes sold for less than $500,000 across New Zealand fell from 39.0% of the market (2,411 properties) in June 2019 to 30.8% of the market (2,041 properties) in June 2020.
The number of properties sold in the $500,000 to $750,000 bracket increased from 30.7% in June 2019 (1,896 properties) to 32.3% in June 2020 (2,141 properties).
At the top end of the market, the percentage of properties sold for $1 million or more increased from 13.2% (819 properties) in June 2019 to 18.0% (1,191 properties) in June 2020.
 John Mazenier: Gaffer Tape And Glue Delivering New Zealand’s Mission Critical Services
 Earthquake Commission: Ivan Skinner Award Winner Inspired By Real-life Earthquake Experience
 Reserve Bank: Consultation Opens On A Digital Currency For New Zealand
 NIWA: Ship Anchors May Cause Extensive And Long-lasting Damage To The Seafloor, According To New Research
 New Zealand Customs Service: A Step Forward For Simpler Trade Between New Zealand And Singapore
 Horizon Research: 68% Say Make Banks Offer Fraud Protection


